World Debug Views
VRChat provides debug views that can help you work through issues in your world. Sometimes these may also contain information for internal VRChat development purposes. User support or staff on Canny may ask you for screenshots of these. In general, however, you should not share these views with other users.
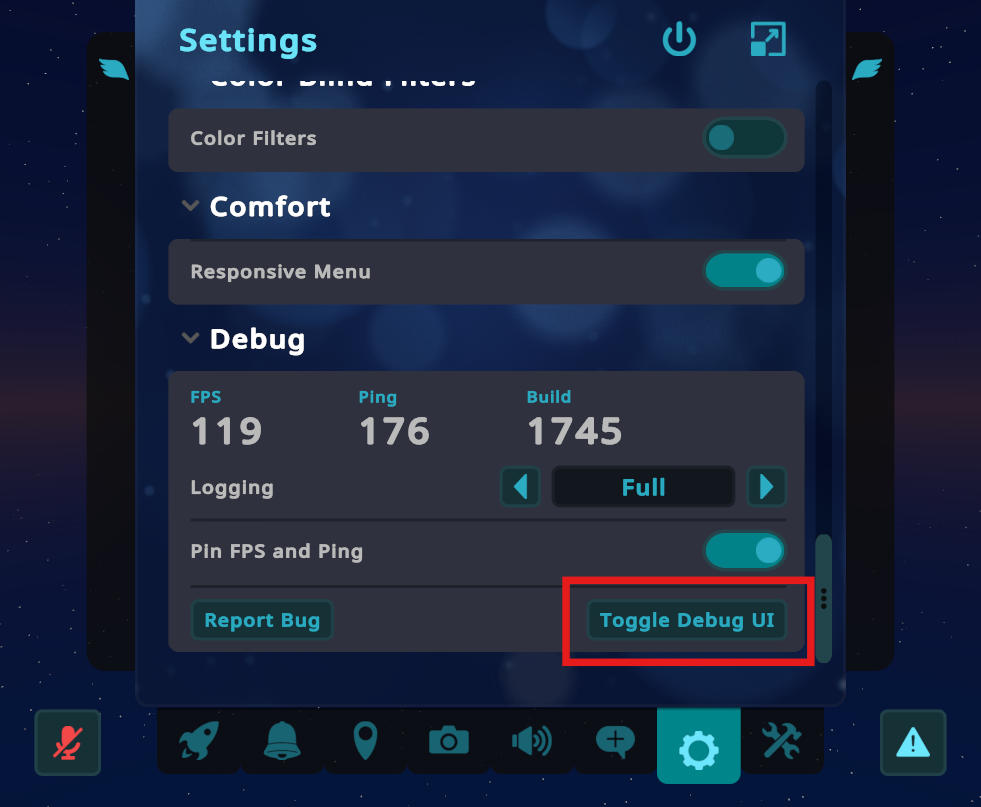
You can access the debug menu via a button at the bottom of the Quick Menu Settings page:
Shortcuts
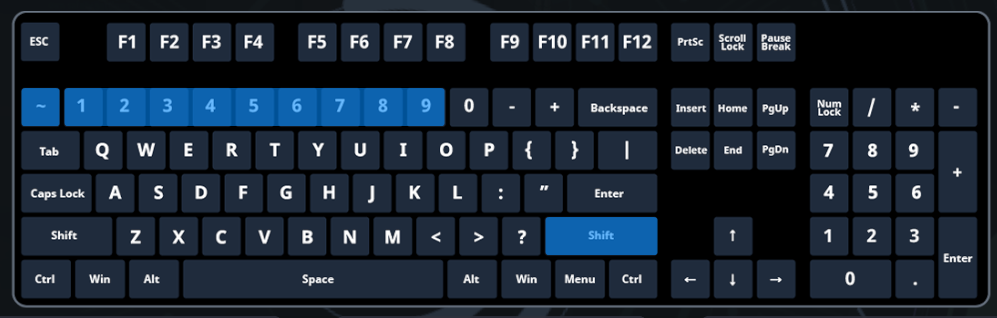
Some debug view pages have a shortcut to open them directly: Right Shift + ~ + < Number >, where "Number" is provided in brackets next to the headlines below.
If you have a keyboard layout where ~ is not directly to the left of the 1 key, try using whichever key is directly to the left of the 1 key, as it prioritizes the position of the key over the character of the key itself.
Restricted Views
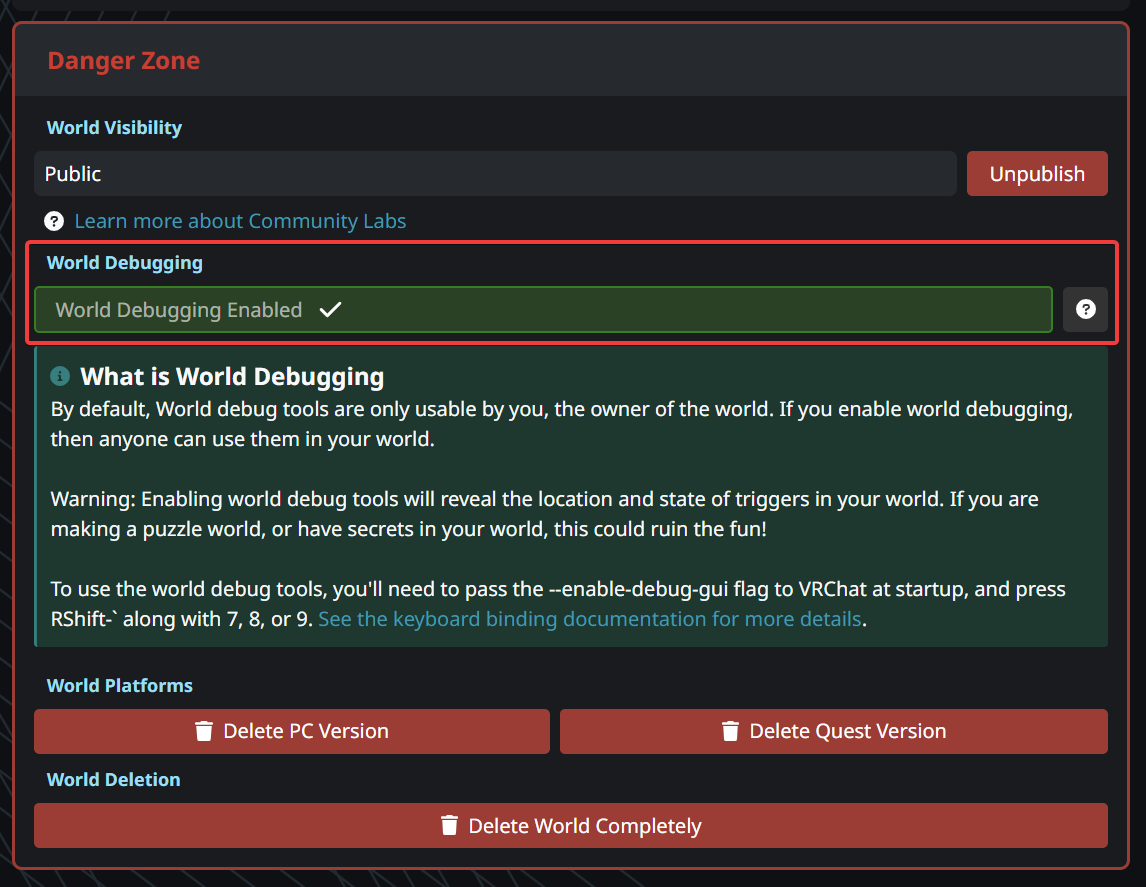
Some debugging views and overlays are restricted. By default, only the world creator can access debug view 6 (Net Objects), the Audio Sourcespage, and world overlays. However, you can allow others to see it as well by enabling World Debugging in your world's settings on the website. Don't forget to click "Save Changes"! Other users need to rejoin the world to be able to access this debug view after you enable World Debugging.
Debug Menu Pages
These debug views are available as tabs in the main debug menu, or directly via their shortcuts.
AssetBundle and Memory View (1)
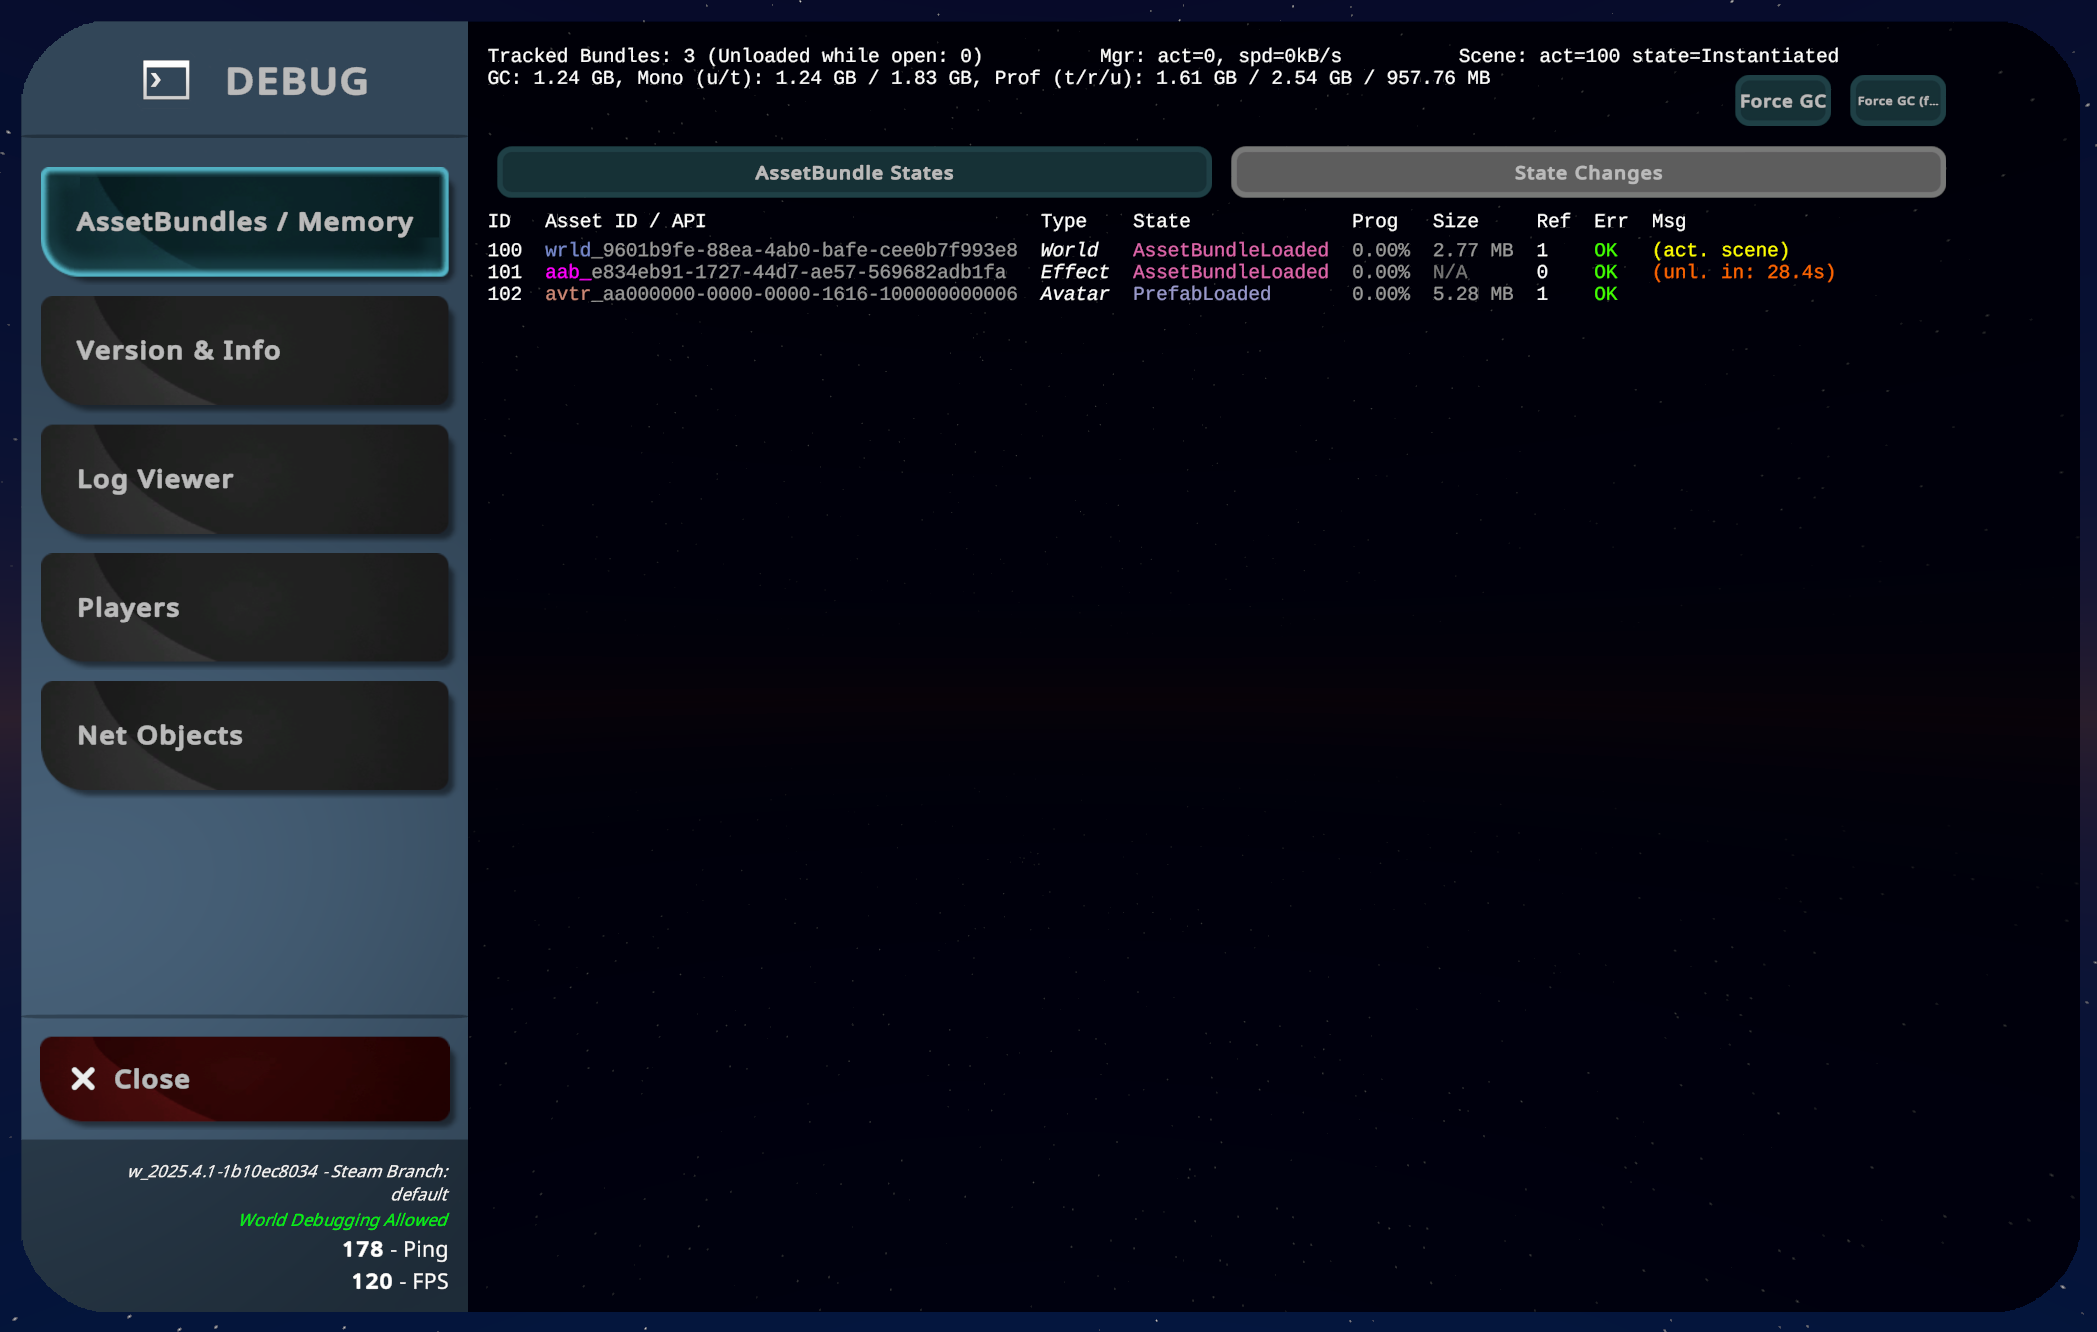
The AssetBundle and Memory page shows information about avatars, worlds, items and other assets that VRChat has currently loaded into memory.
This view is primarily for troubleshooting VRChat and is rarely useful during world development.
The "Force GC" and "Force GC (full)" buttons will trigger an internal garbage collection pass. This may appear to decrease memory usage, but is not recommended to be used without full understanding of what this does.
It will NOT improve performance or actually help with RAM usage! On the contrary, it may cause performance issues or instability if used repeatedly.
Version & Info (2)
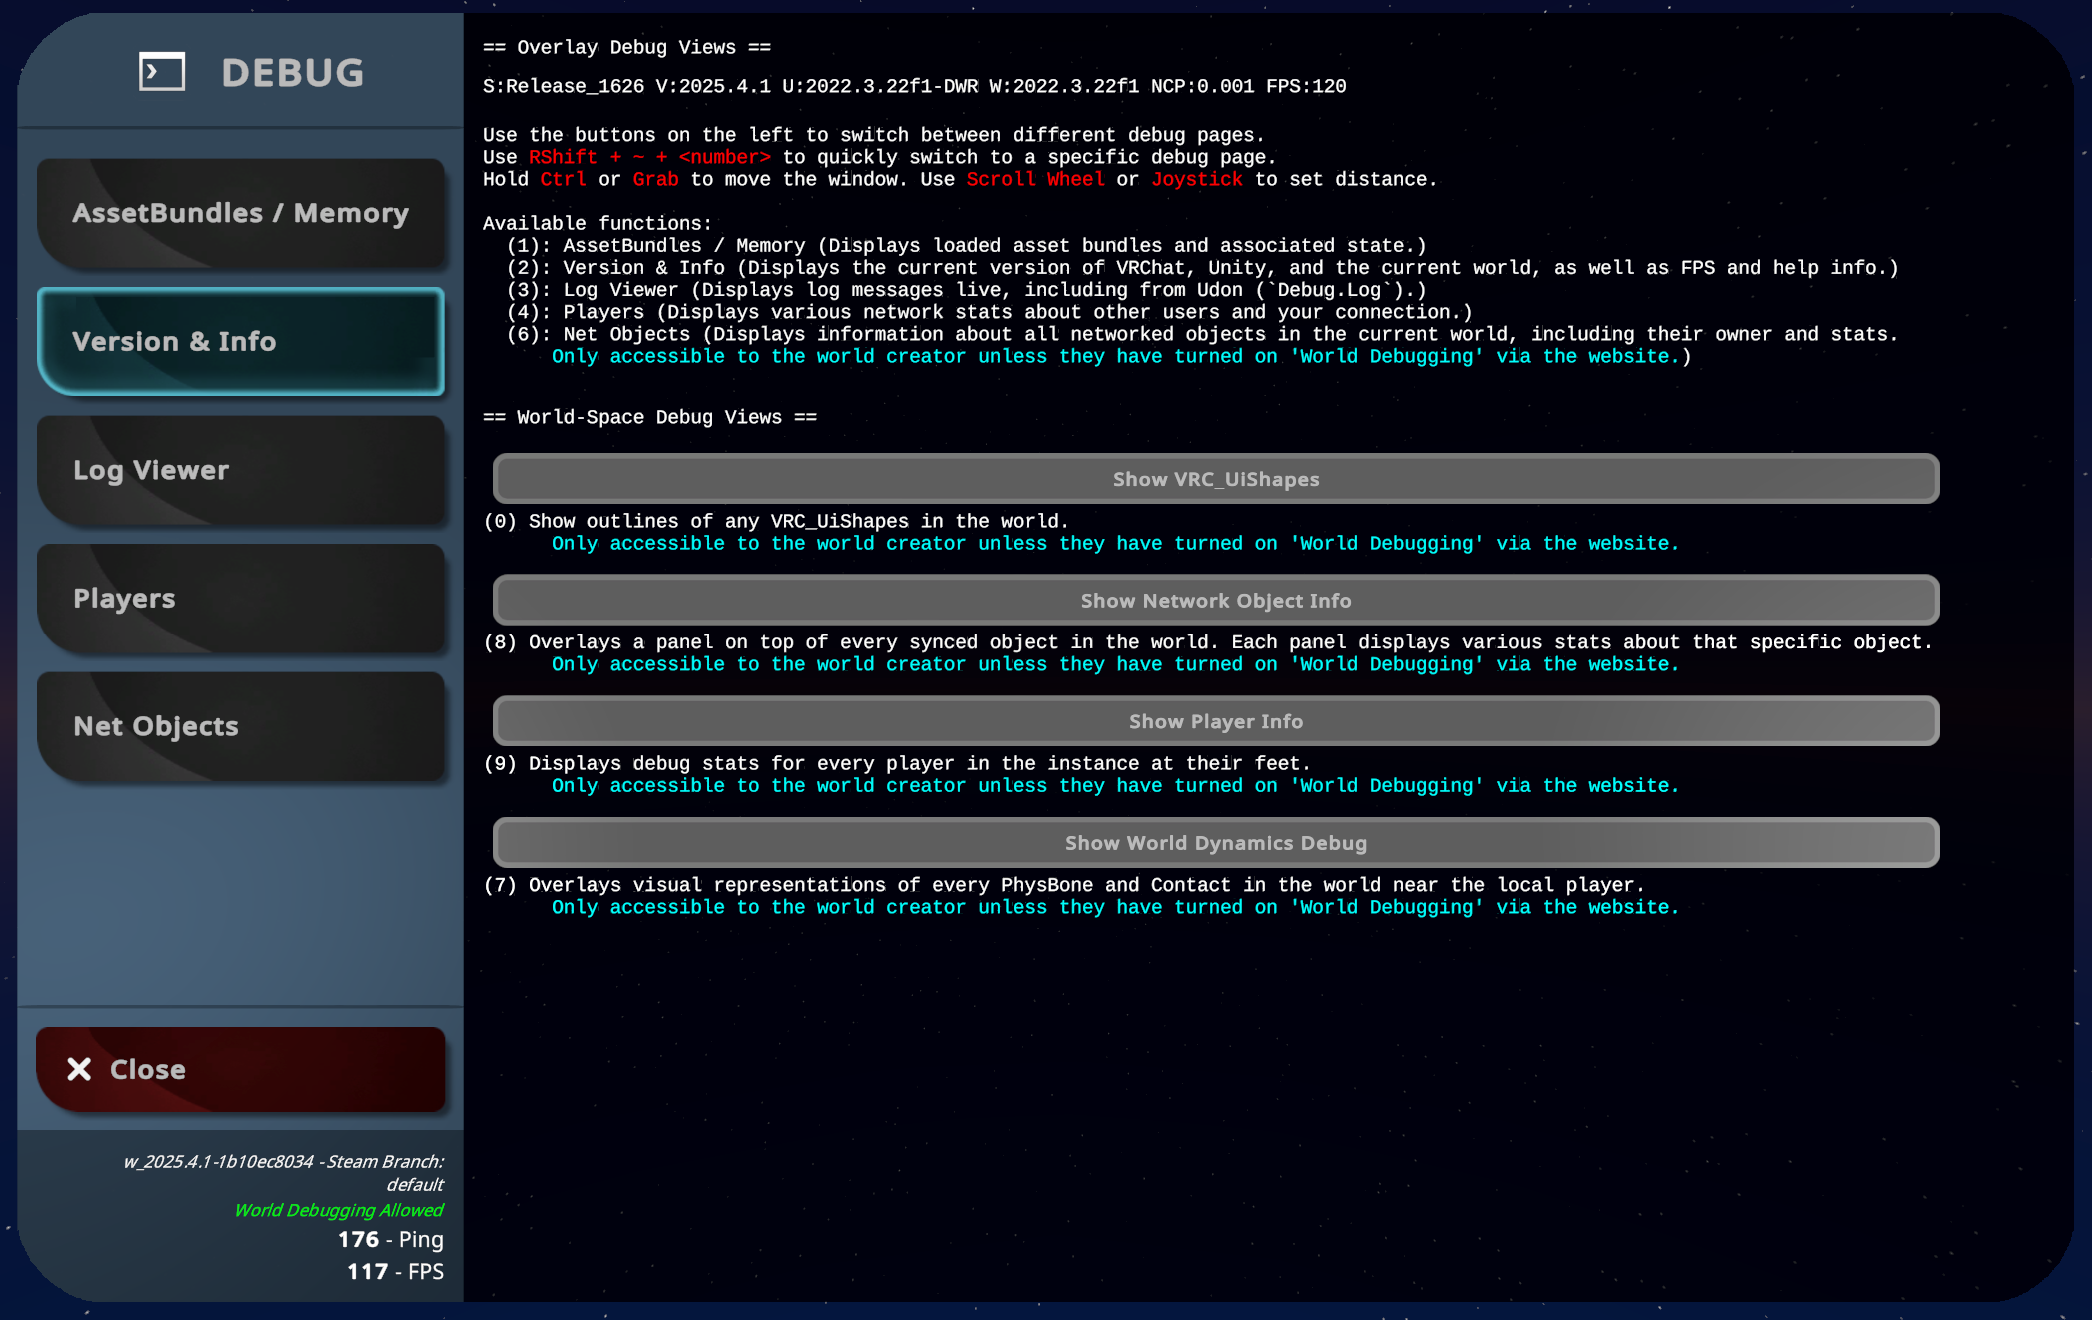
The Version & Info page shows some help information about the debug view system, the current build of VRChat you are running and information about hotkeys (in red). The buttons let you toggle between the different debug world overlays.
Note that toggling this view with its shortcut (Right Shift + ~ + 2) first toggles a minimal HUD variant that only shows basic information. Pressing the shortcut again opens the full debug view.
Log Viewer (3)
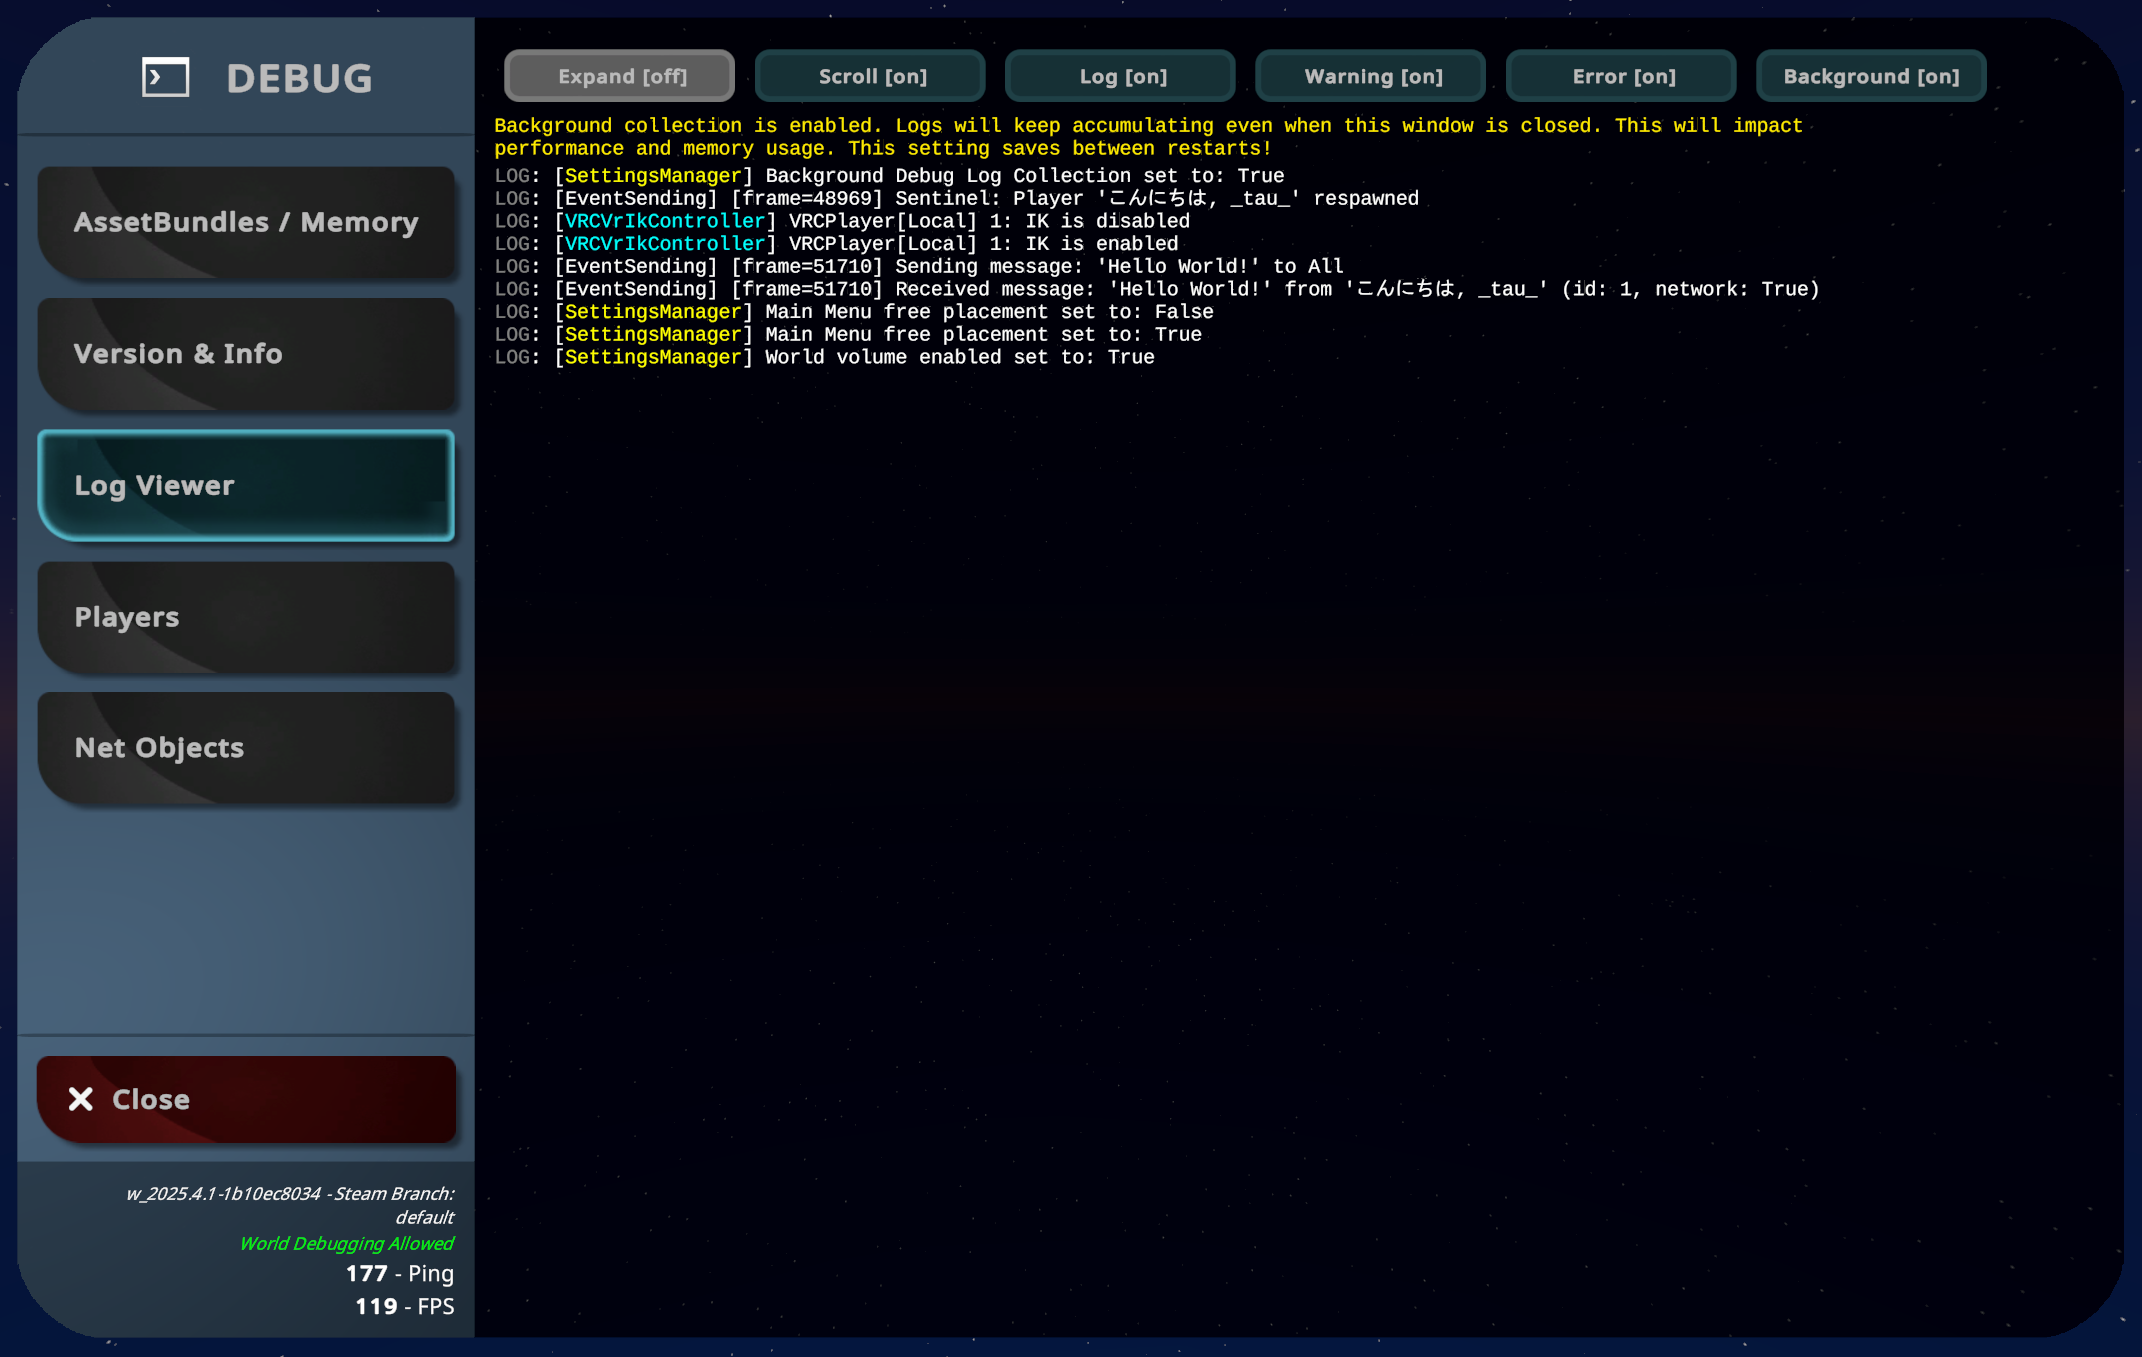
The log viewer page displays your output log. It can show you important information, such as Udon Behaviour crashes, any information logged via the Debug.Log function, and any other potential errors in your world generated by Unity or VRChat.
The buttons at the top enable or disable certain log types and can be used as filters.
The "Background" option collects logs in this view even when the debug option is closed. It persists between restarts, but warns you once on startup if it is active.
Collecting logs in the background can have a noticeable performance impact.
Players (4)
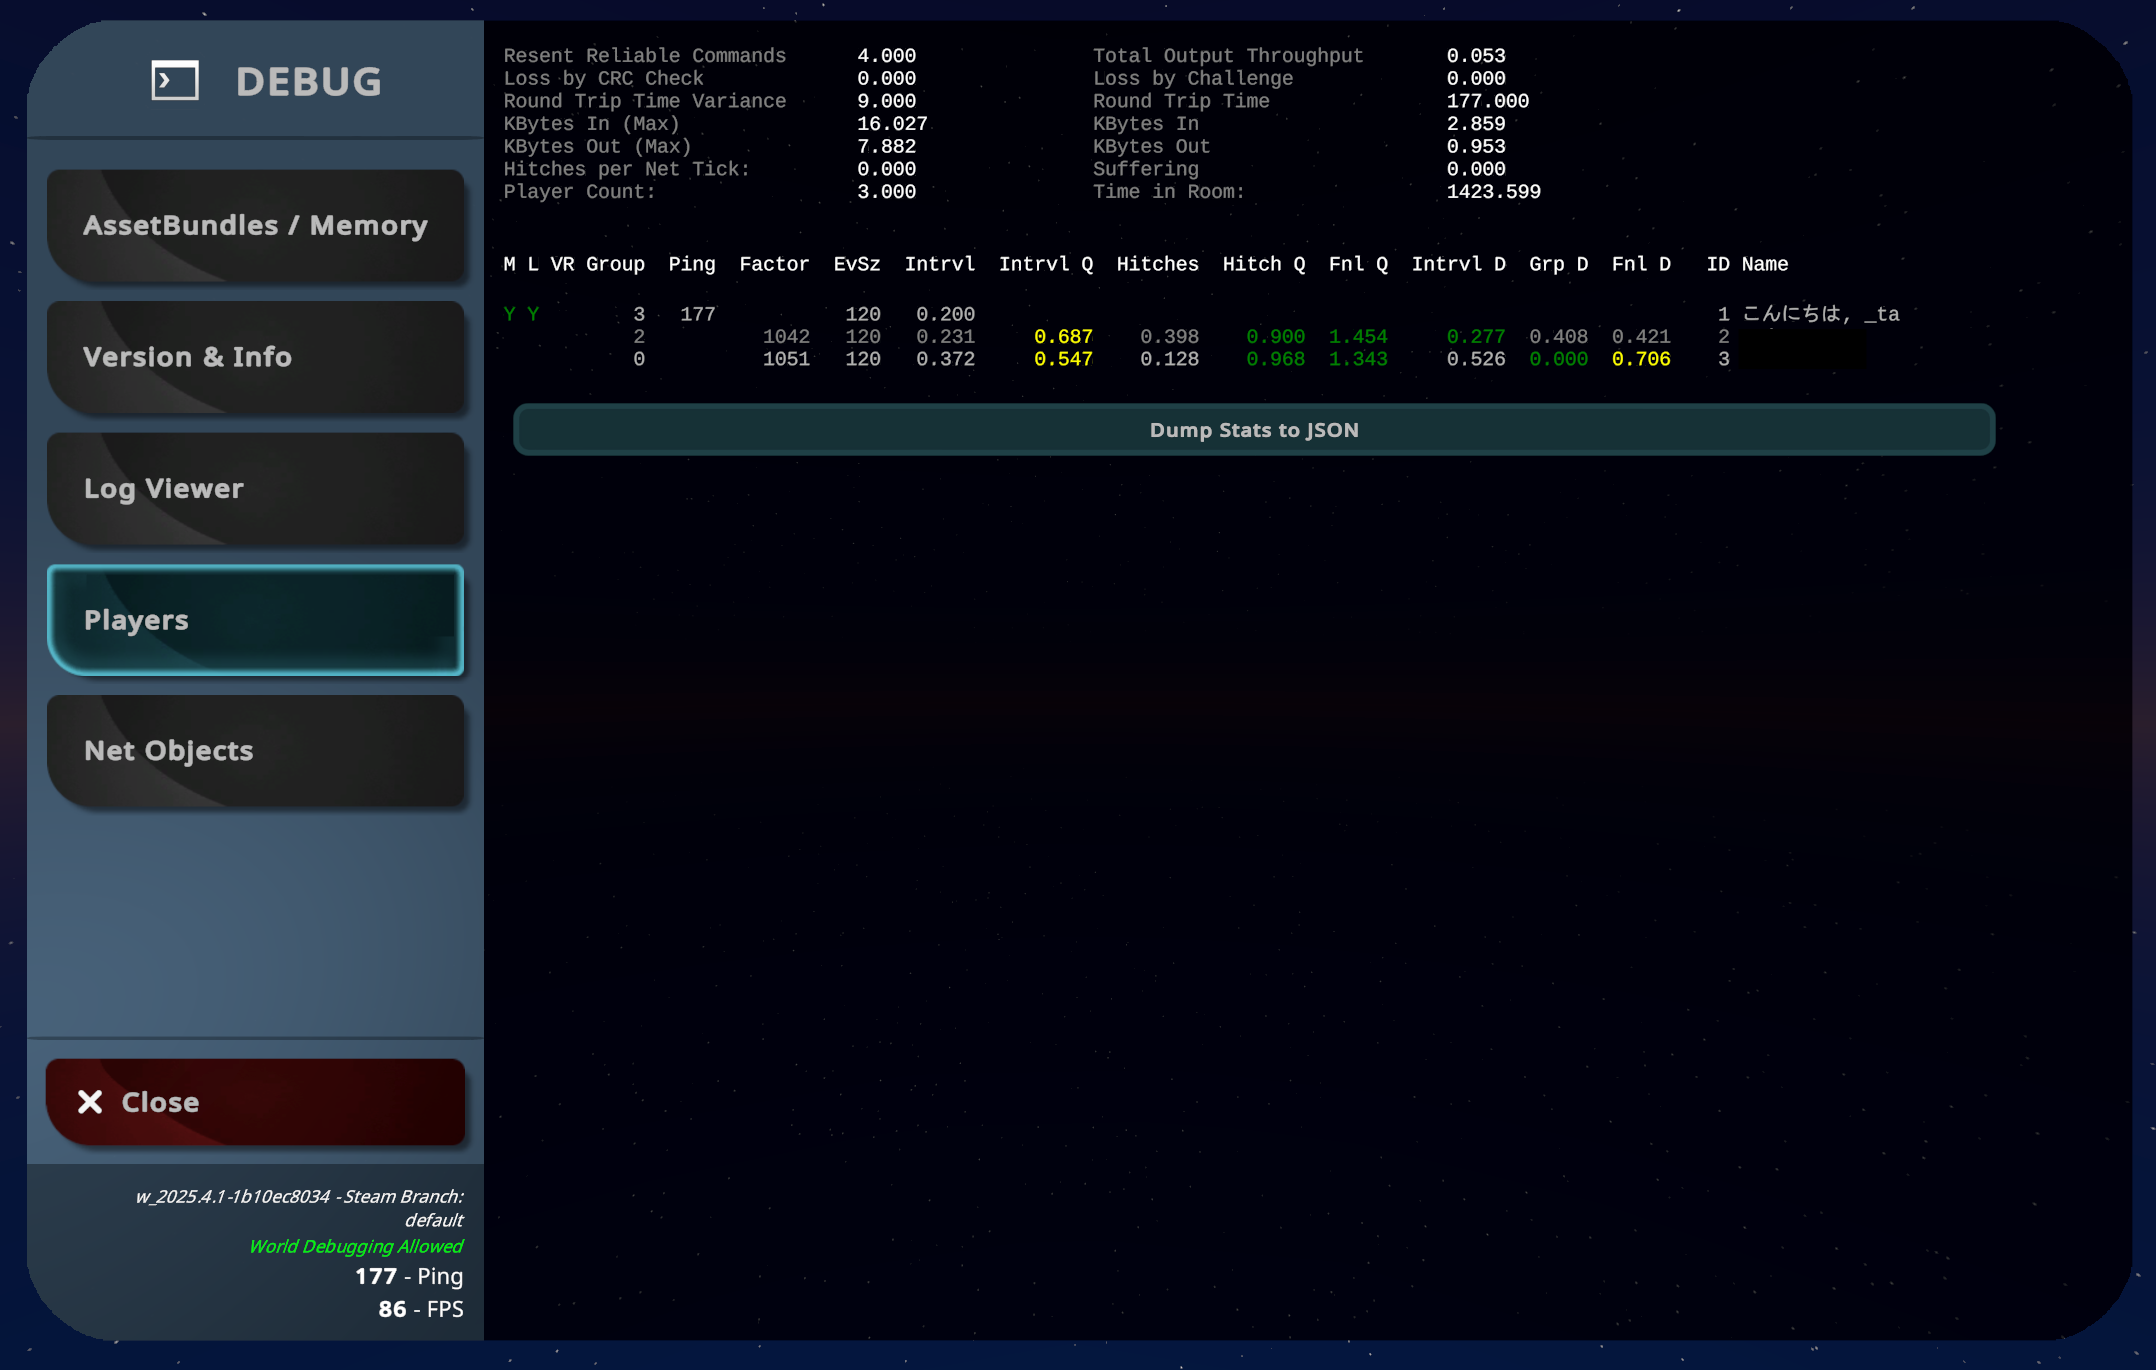
Debug View 4 displays various stats about other players.
- M: Whether or not the player is the master of the instance
- L: Whether or not the player is the local player
- VR: Whether or not the player is in VR
- Group: The current group that the player is in. Grouping in this context is an internal networking system used to combine multiple objects together by distance so that their data can be sent together.
- Intrvl: The amount of time between the player sending synced data about themselves.
- Fnl D: The desired delay that the internal system is targeting. The actual delay is frequently adjusted to find a good balance between latency and smoothness.
The top includes some general information about the current realtime networking state. The "Suffering" field, for example, shows whether the world's Udon behaviours are sending too much data. Udon can inspect most of these values using the Network Stats API.
The button at the bottom dumps some stats into a JSON file. This file goes to the same folder as logs. It is mostly useful for internal testing purposes and should not be relied on for working on worlds.
Net Objects (6)
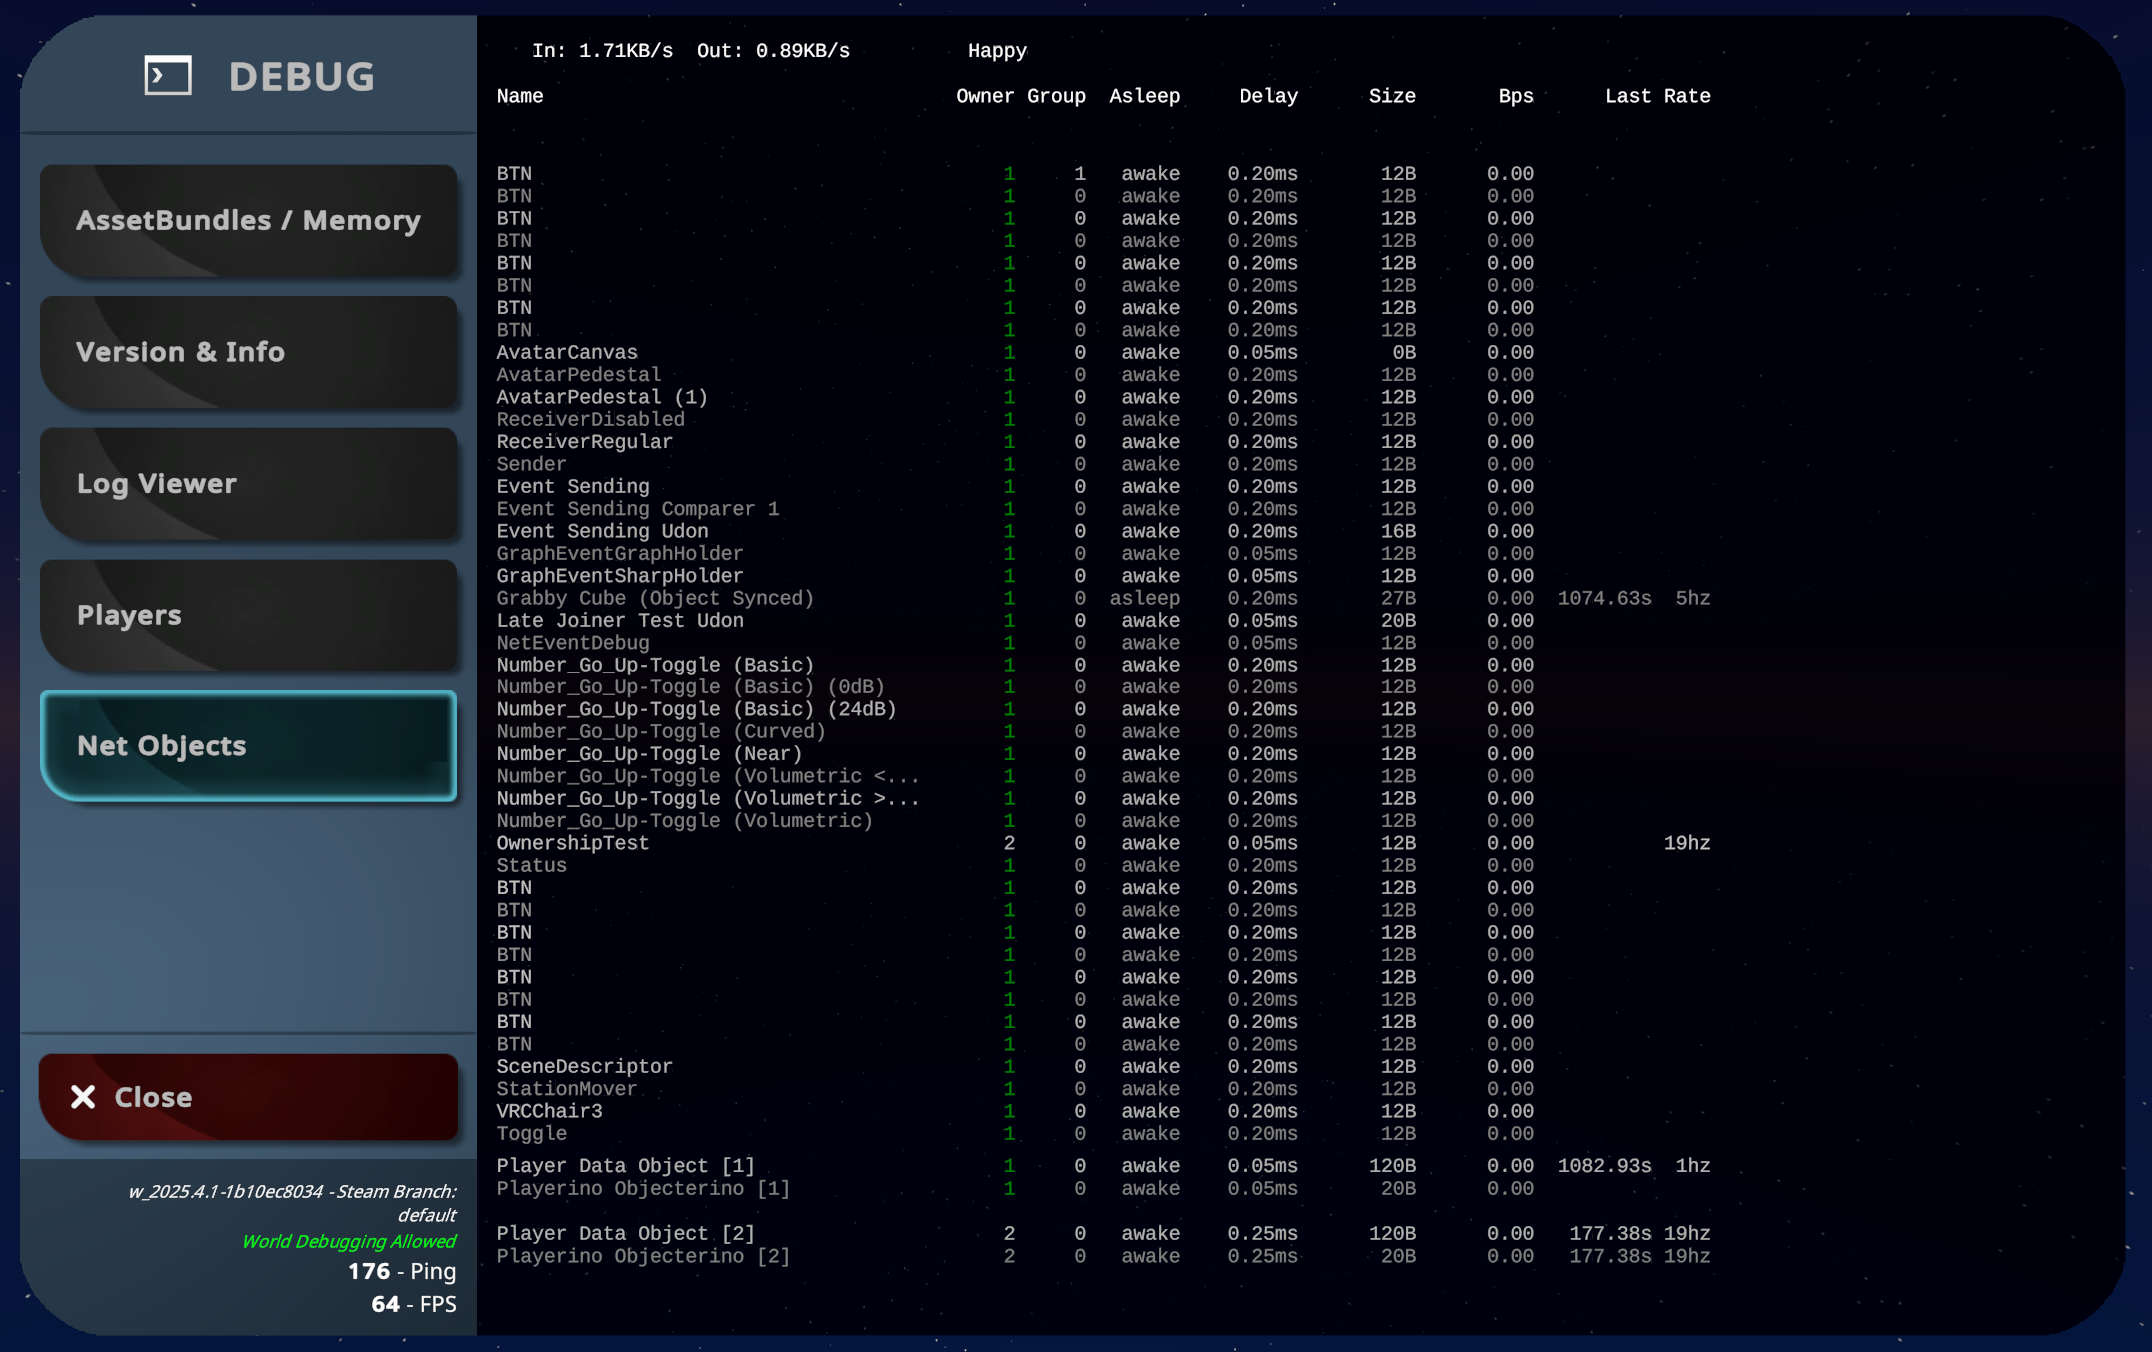
The Net Objects page displays all the networked objects in your world, along with various stats.
- Owner: The playerid of the owner of the object.
- Group: The current group that this object is in. Grouping in this context is an internal networking system used to combine multiple objects together by distance so that their data can be sent together.
- Sleeping: Whether or not the object is sleeping. Only objects with VRCObjectSync can sleep. Sleeping causes the object to stop transmitting data.
- Delay: The current delay of this object between the owner and the viewer
- Size: The current number of bytes per serialization of this object. Every time it needs to sync, it will send this many bytes.
- Bps: A rough approximation of how many bytes per second this object is using up.
- Since Last: A running counter of how long it has been since the last time this object has sent data.
- Interval: A rough approximation of how many times this object tries to sync per second.
Note that with many objects, this page can cause some performance slowdowns while open.
Audio Sources
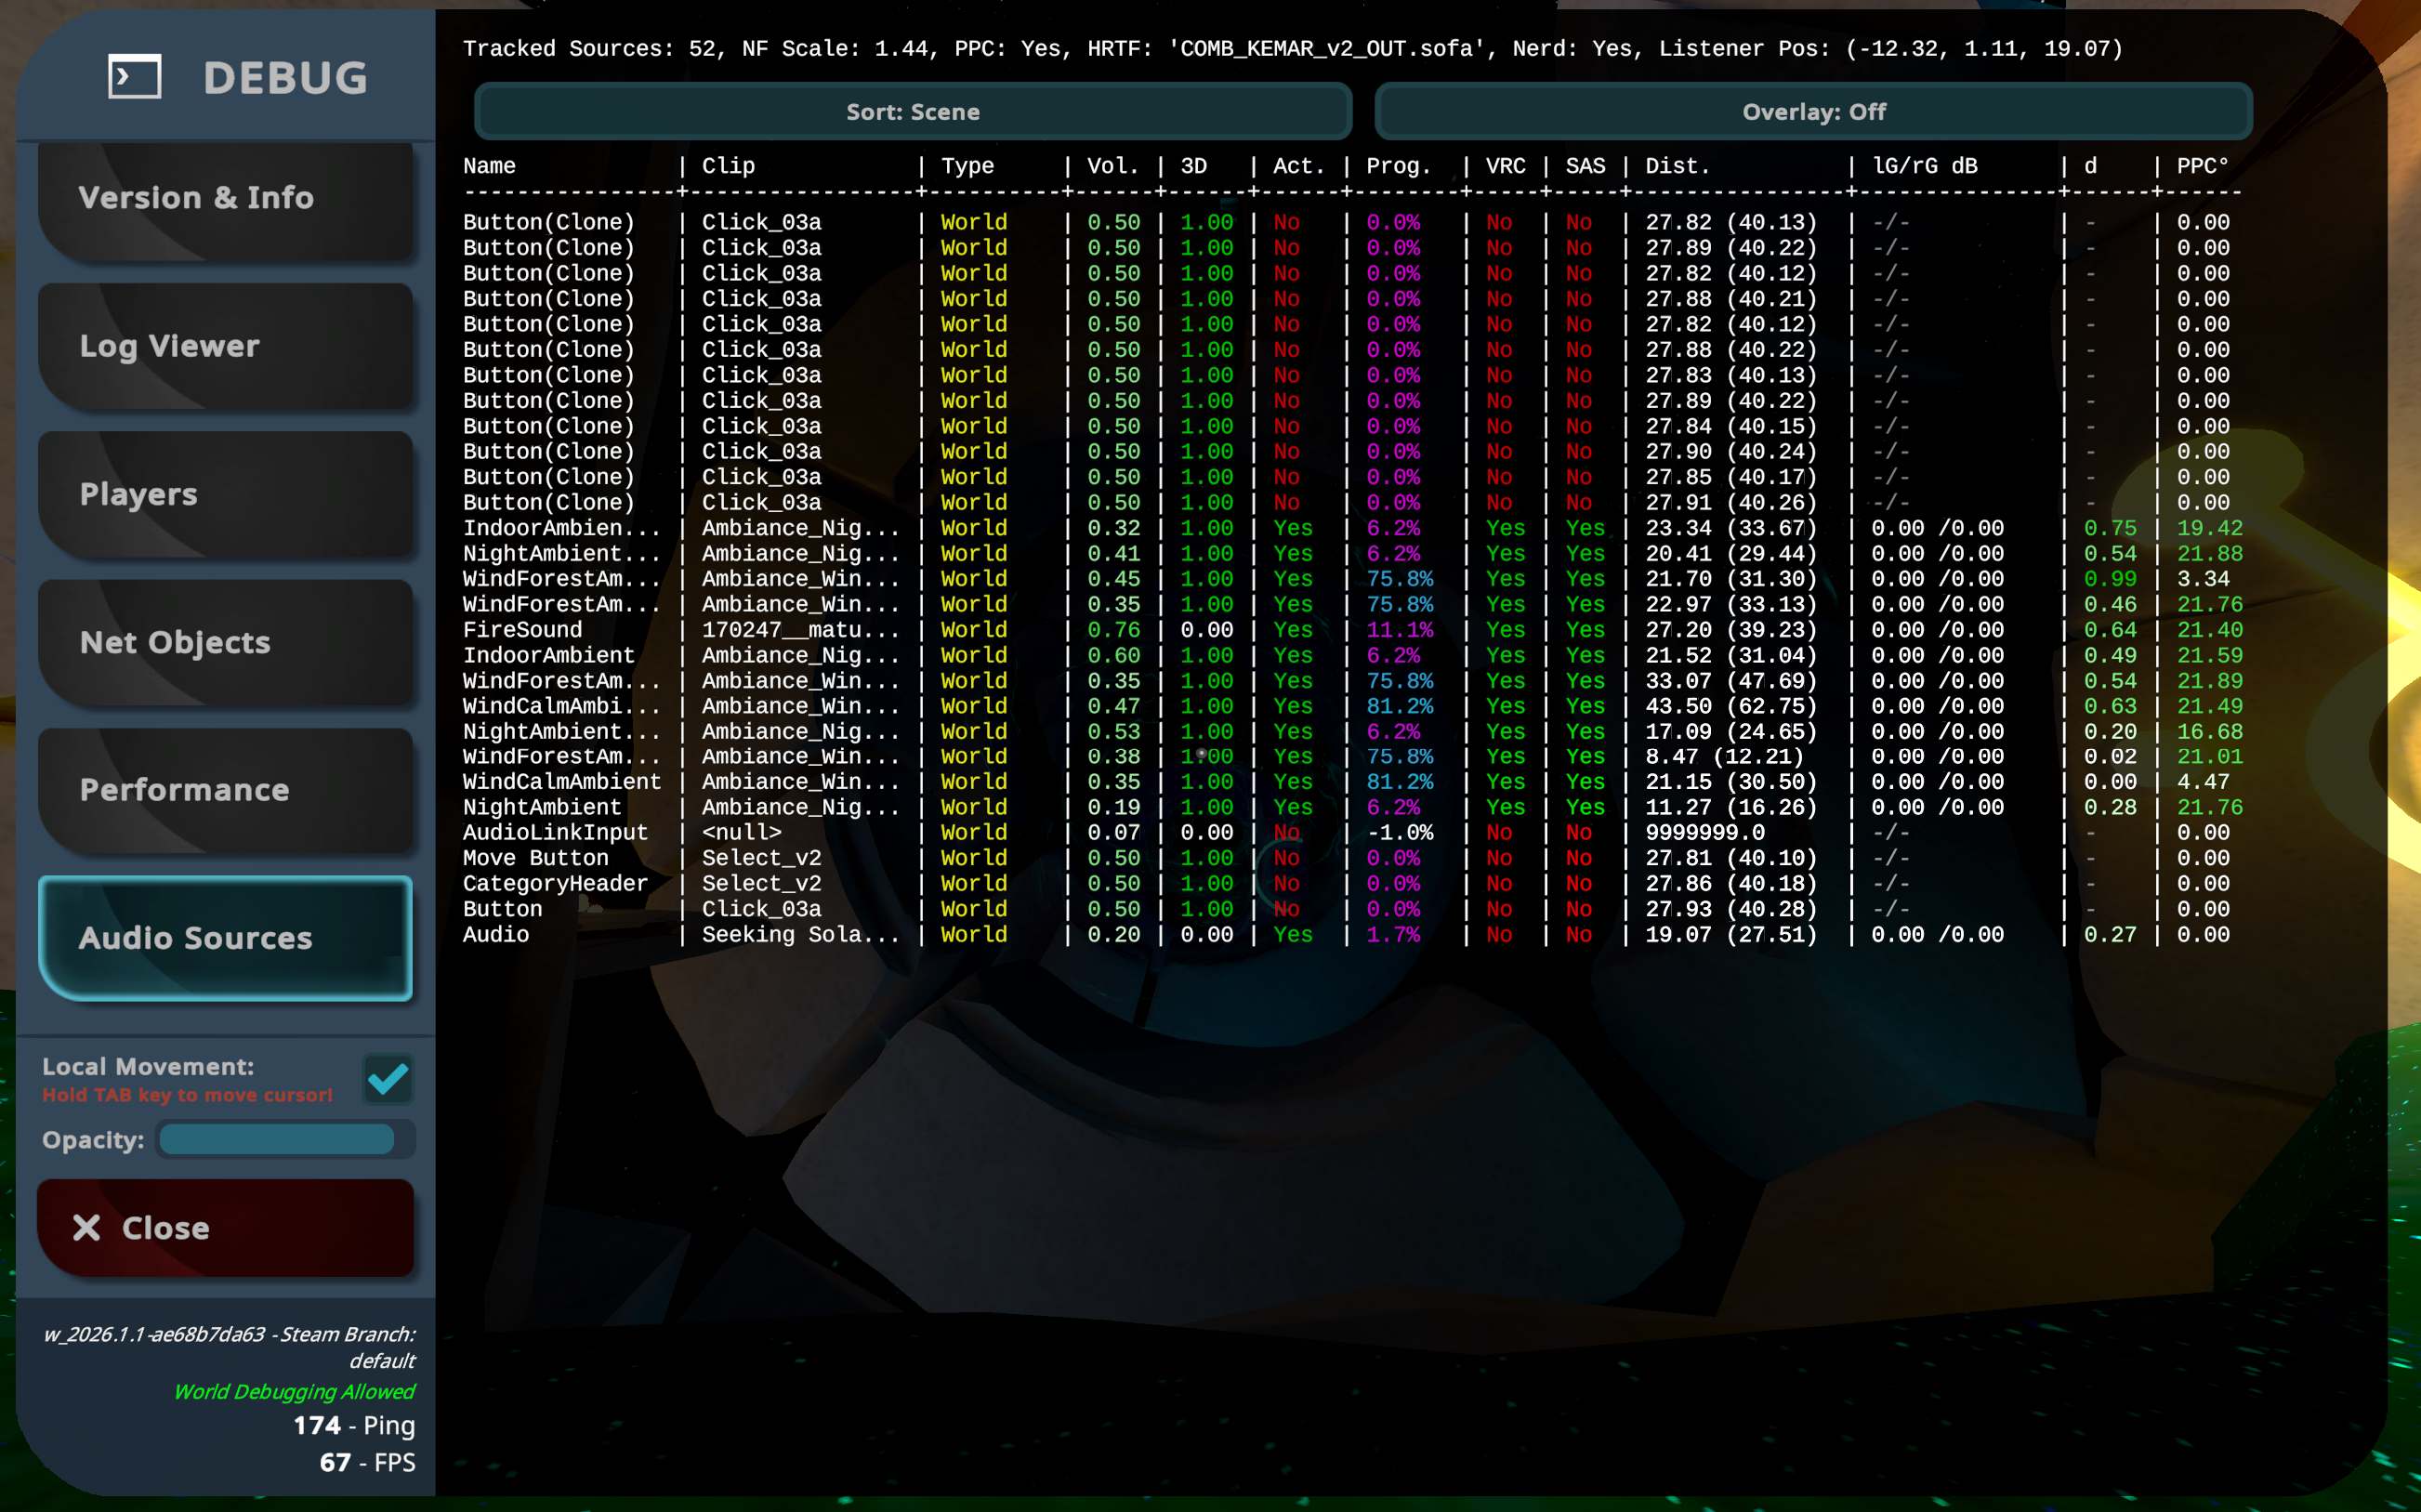
The Audio Sources page displays information about all currently active AudioSource components in a world. Some of the info displayed is only useful for internal debugging.
- Name:
GameObjectname. - Clip: Name of the assigned
AudioClip. Does not account forPlayOneShot.<null>if unset. - Type: Whether the source is present in the world, an avatar, or internal. To regular users, only
Worldsources are visible. - Vol: Volume of the source as set in Unity. Does not include
Gainfrom theVRC_SpatialAudioSource. - 3D: The
spatialBlendvalue. - Act/Prog: Whether or not the source is currently playing, and its current progress relative to the
Clipassigned.-1.0%if no clip is assigned. - VRC/SAS: Whether or not the source has a
VRC_SpatialAudioSource, and whether it has been converted to Steam Audio. - Dist: Distance to the audio source (physical units) and in brackets the virtual distance used for near-field calculations (affected by avatar scale).
- lG/rG dB: Left/Right ear volume offset for near-field emulation in decibels (offset, not dbFS).
- d: Directionality factor for calculating lG/rG.
- PPC°: Perspective correction offset. The value in degrees estimates the angle between where the source is relative to the audio listener in physical units and where it appears to be after applying desktop or camera perspective correction.
Sources can be sorted by Scene (load order) or by distance from the listener. Use the button at the top to switch sorting.
You can toggle an additional overlay that shows basic rays and positional information for nearby AudioSources. This is primarily intended for internal use.
This page requires world debugging permissions.
Debug World Overlays
Overlays are not pages in the debug menu, but instead show data directly in the world around you.
You can enable them via their shortcuts, or from the "Version & Info (2)" page.
All of these require "World Debugging" to be enabled, or for you to have uploaded the current world yourself. The status of World Debugging is displayed in the bottom left corner of the debug menu.
PhysBone & Contact Overlay (7)
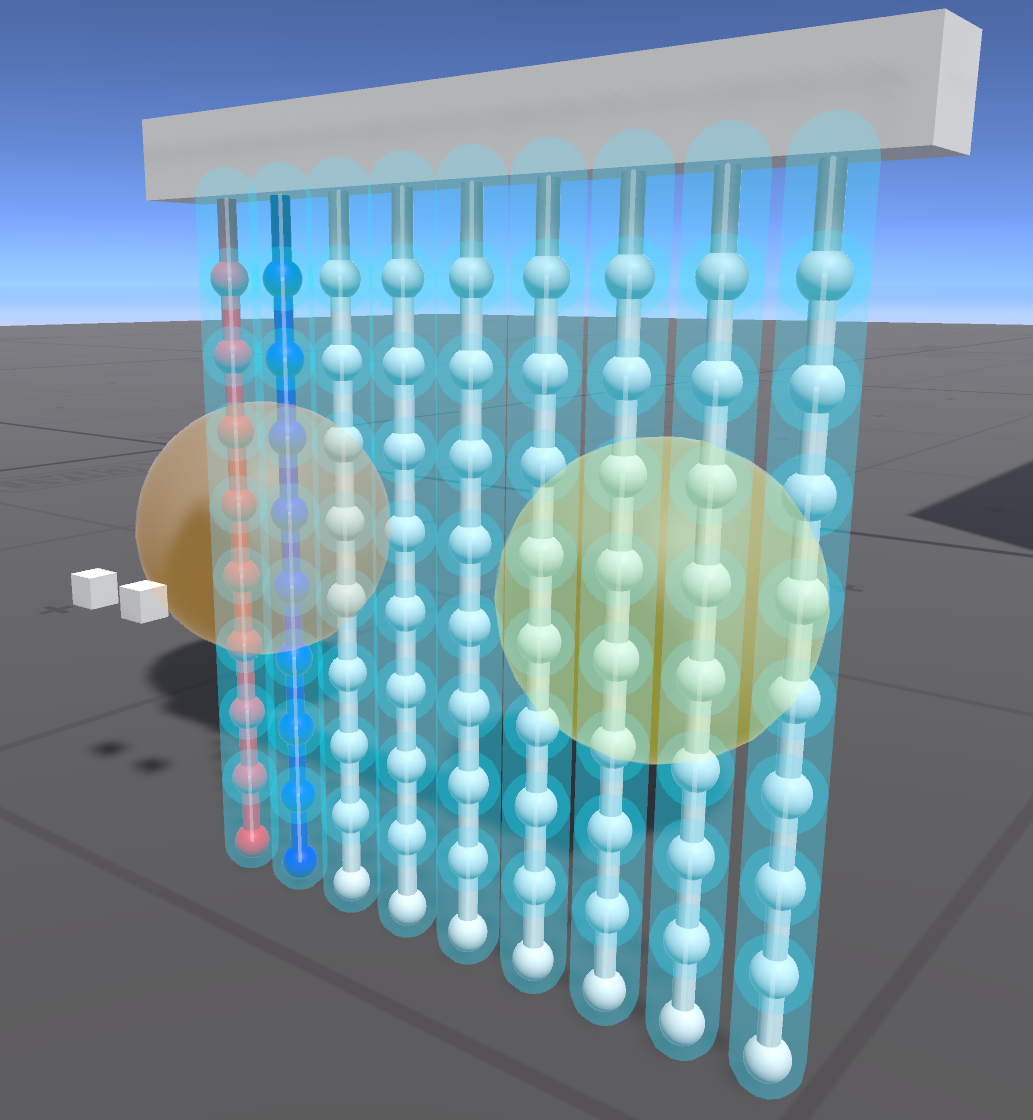
Debug view 7 highlights all nearby PhysBones and Contacts in the world. This can be useful for debugging these components when they aren't behaving in the way you're expecting them to.
Network Object Info Overlay (8)
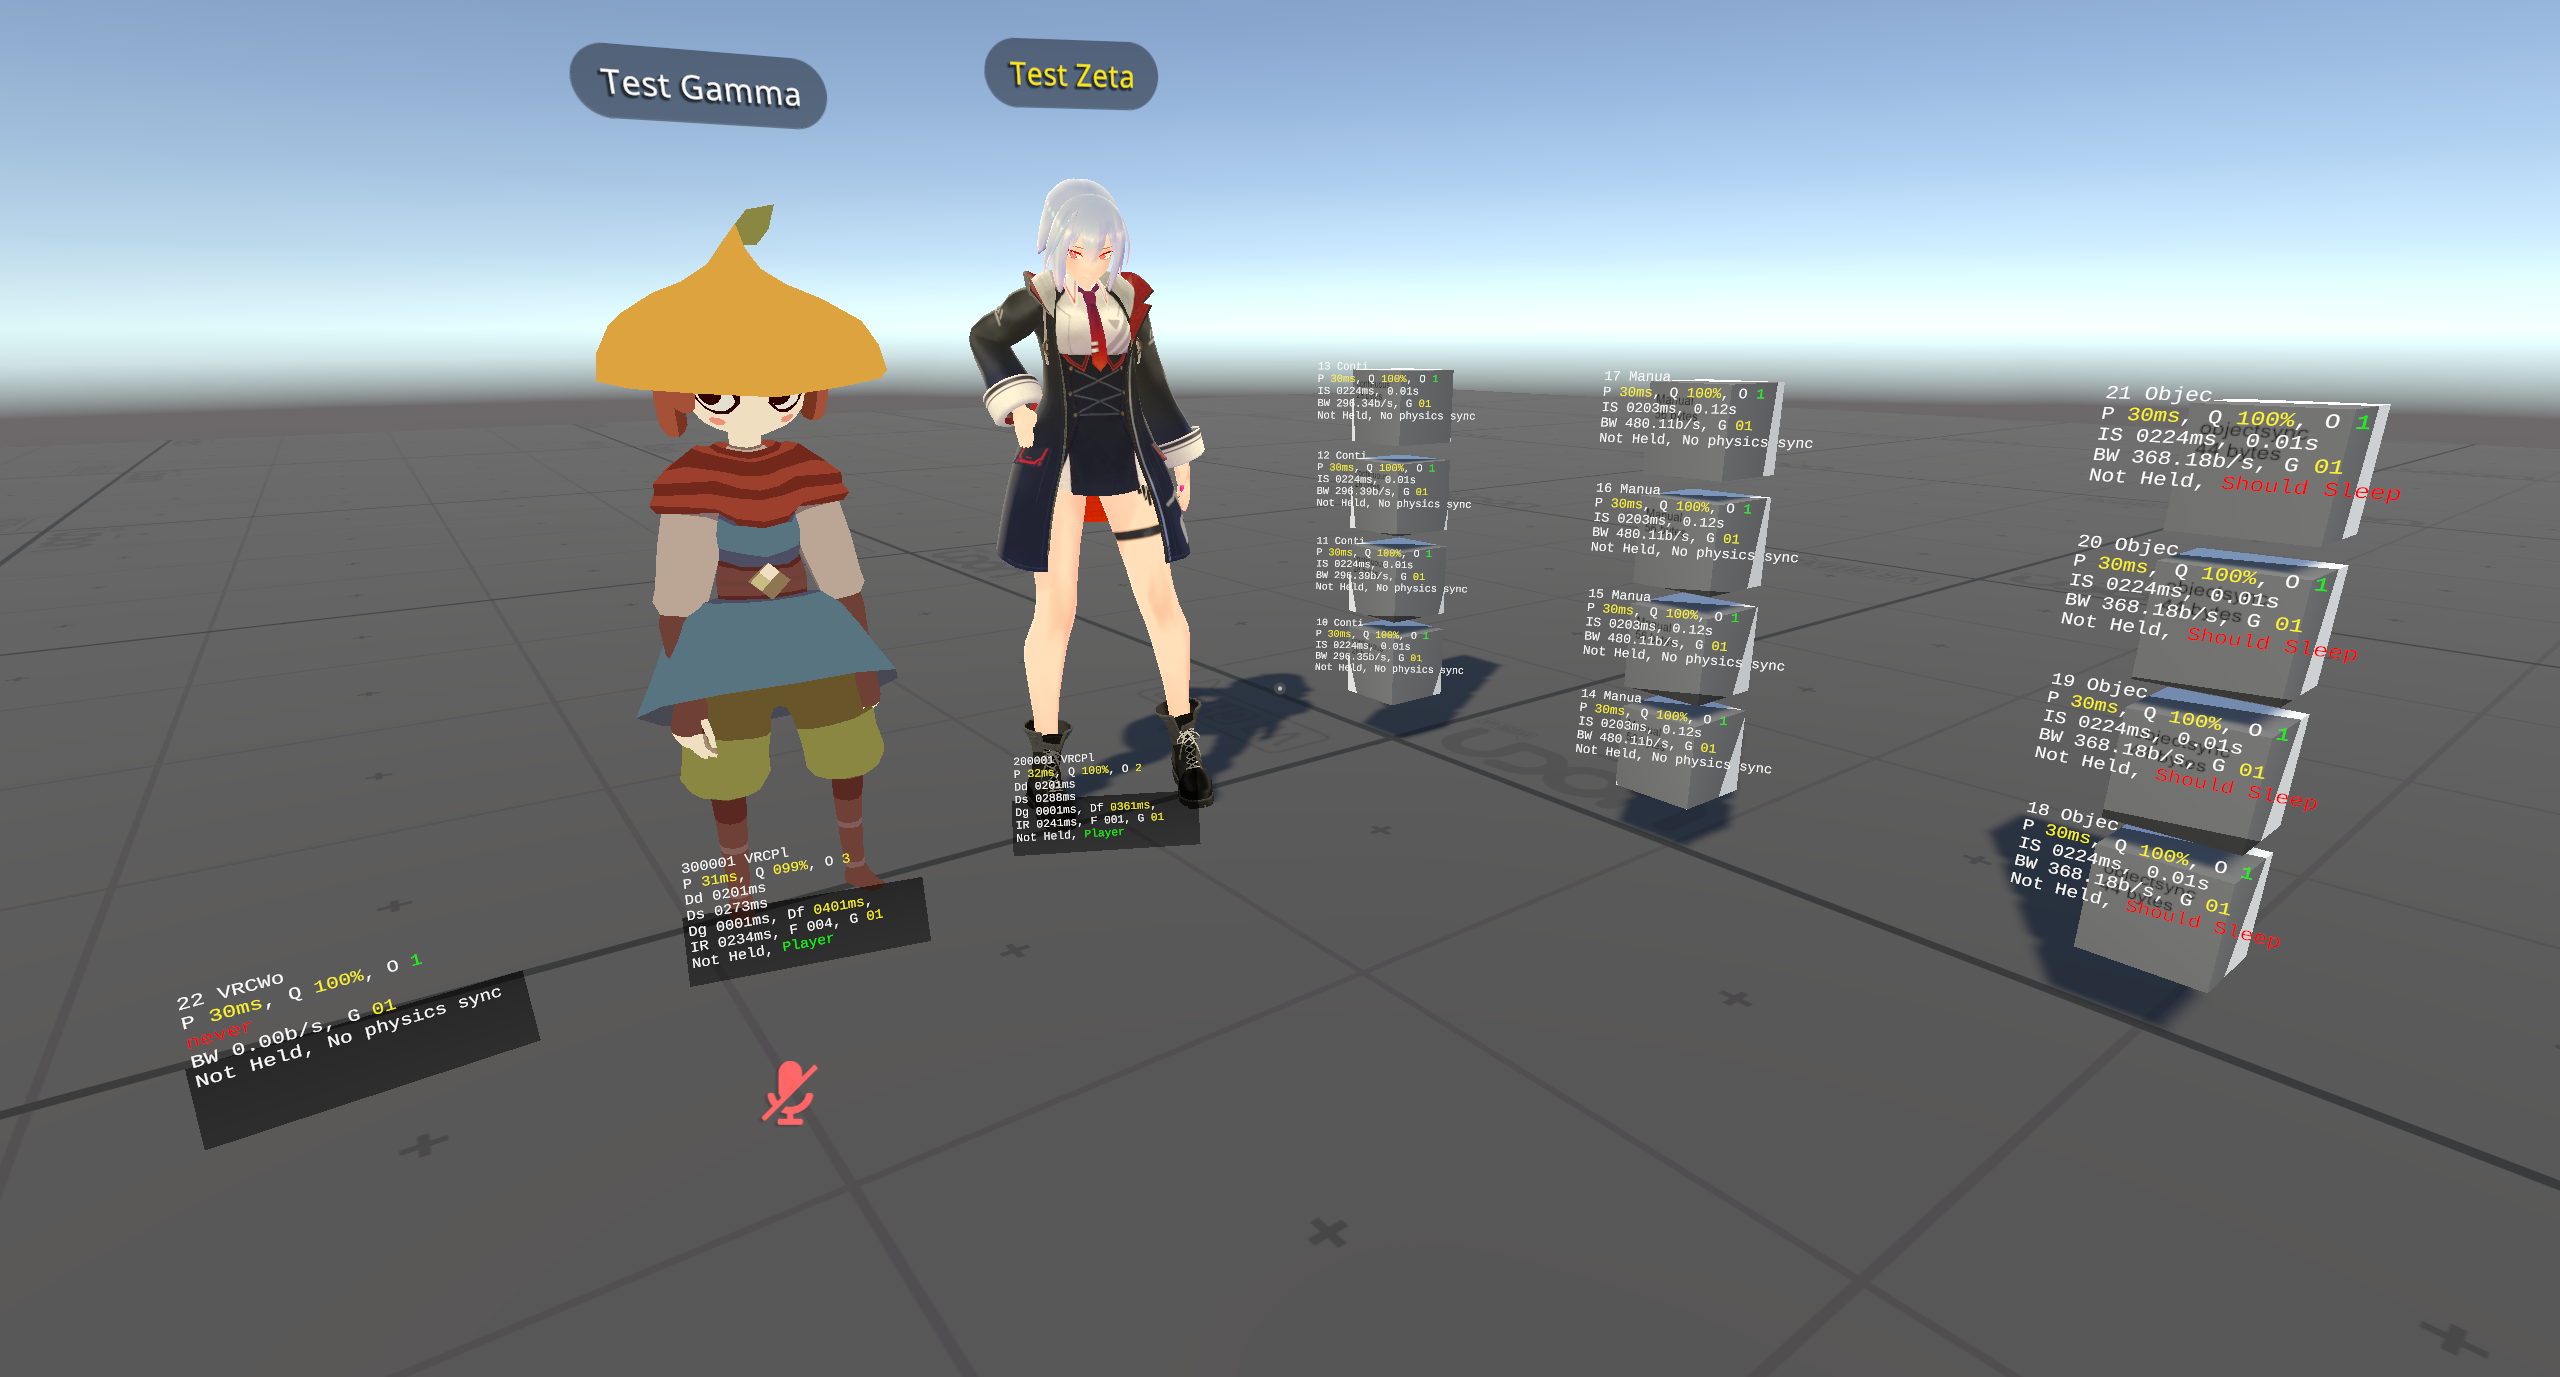
The Network Object Info Overlay displays a panel on top of every synced object in the world. Each panel displays various stats about that specific object:
- P: Ping of the owner
- Q: Quality of the data (100% is no dropped packets)
- O: PlayerID of the owner of the object
- G: The current group that this object is in. Grouping in this context is an internal networking system used to combine multiple objects together by distance so that their data can be sent together.
- Held: Whether or not this object is held, if it is a pickup
- Status: Displays various things about what this object is doing, such as
Should Sleep,Player,Held, orDiscontinuity
Player Info Overlay (9)
Similar to the "Network Object Info Overlay (8)", this displays debug stats for every player on a panel at their feet.
VRC_UiShape Debug Overlay (0)
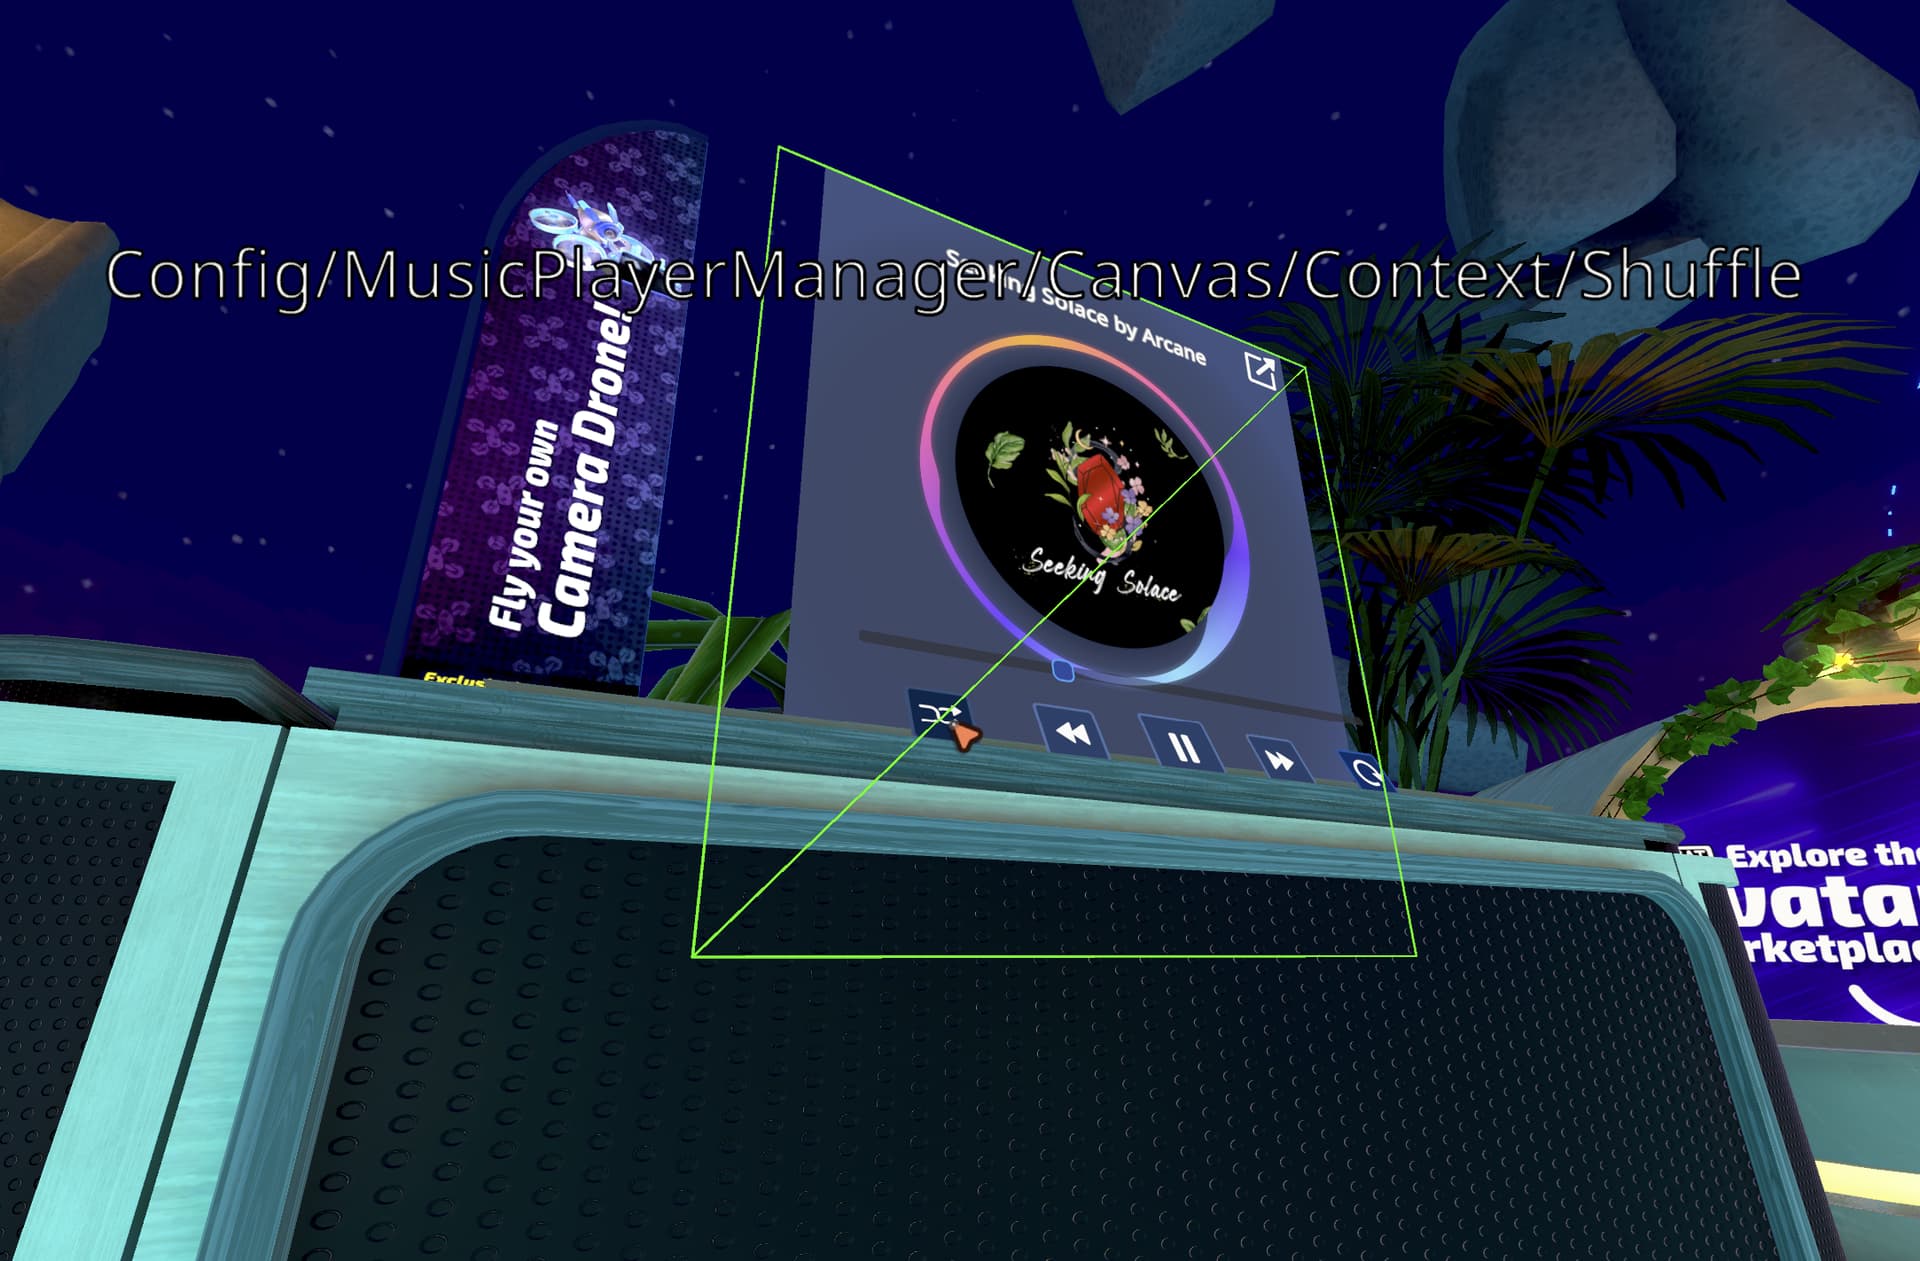
The VRC_UiShape Debug Overlay shows the outlines of every VRC_UiShape in your world. In addition, it shows a text overlay on your screen (desktop mode) or on your hands (VR mode), indicating what you are currently pointing at. Use it to diagnose UI interaction issues in your world.